Logging
Logging (Audit Trail) records all events produced on the platform: authentications, application openings, password sharing, Shadow IT detections, administration actions, billing events… Each event is typed, classified into a category, and carries a severity level, referencing the entities it concerns (user, application, folder, device, password…).
It is this same log that feeds notifications and the webhook audit.event: there is only one source of truth for the organization's history.
Main Page
Access the log from the Compliance menu in the administrator sidebar, under the Logging tab.
The organization's log opens to the explorer; the schema view and the detailed list are just a click away from the toolbar.
Explorer
The explorer provides an overview of the organization's activity, regardless of its size: a timeline to choose a period, then, during this period, the connection paths, active people, and the detailed path of one of them.
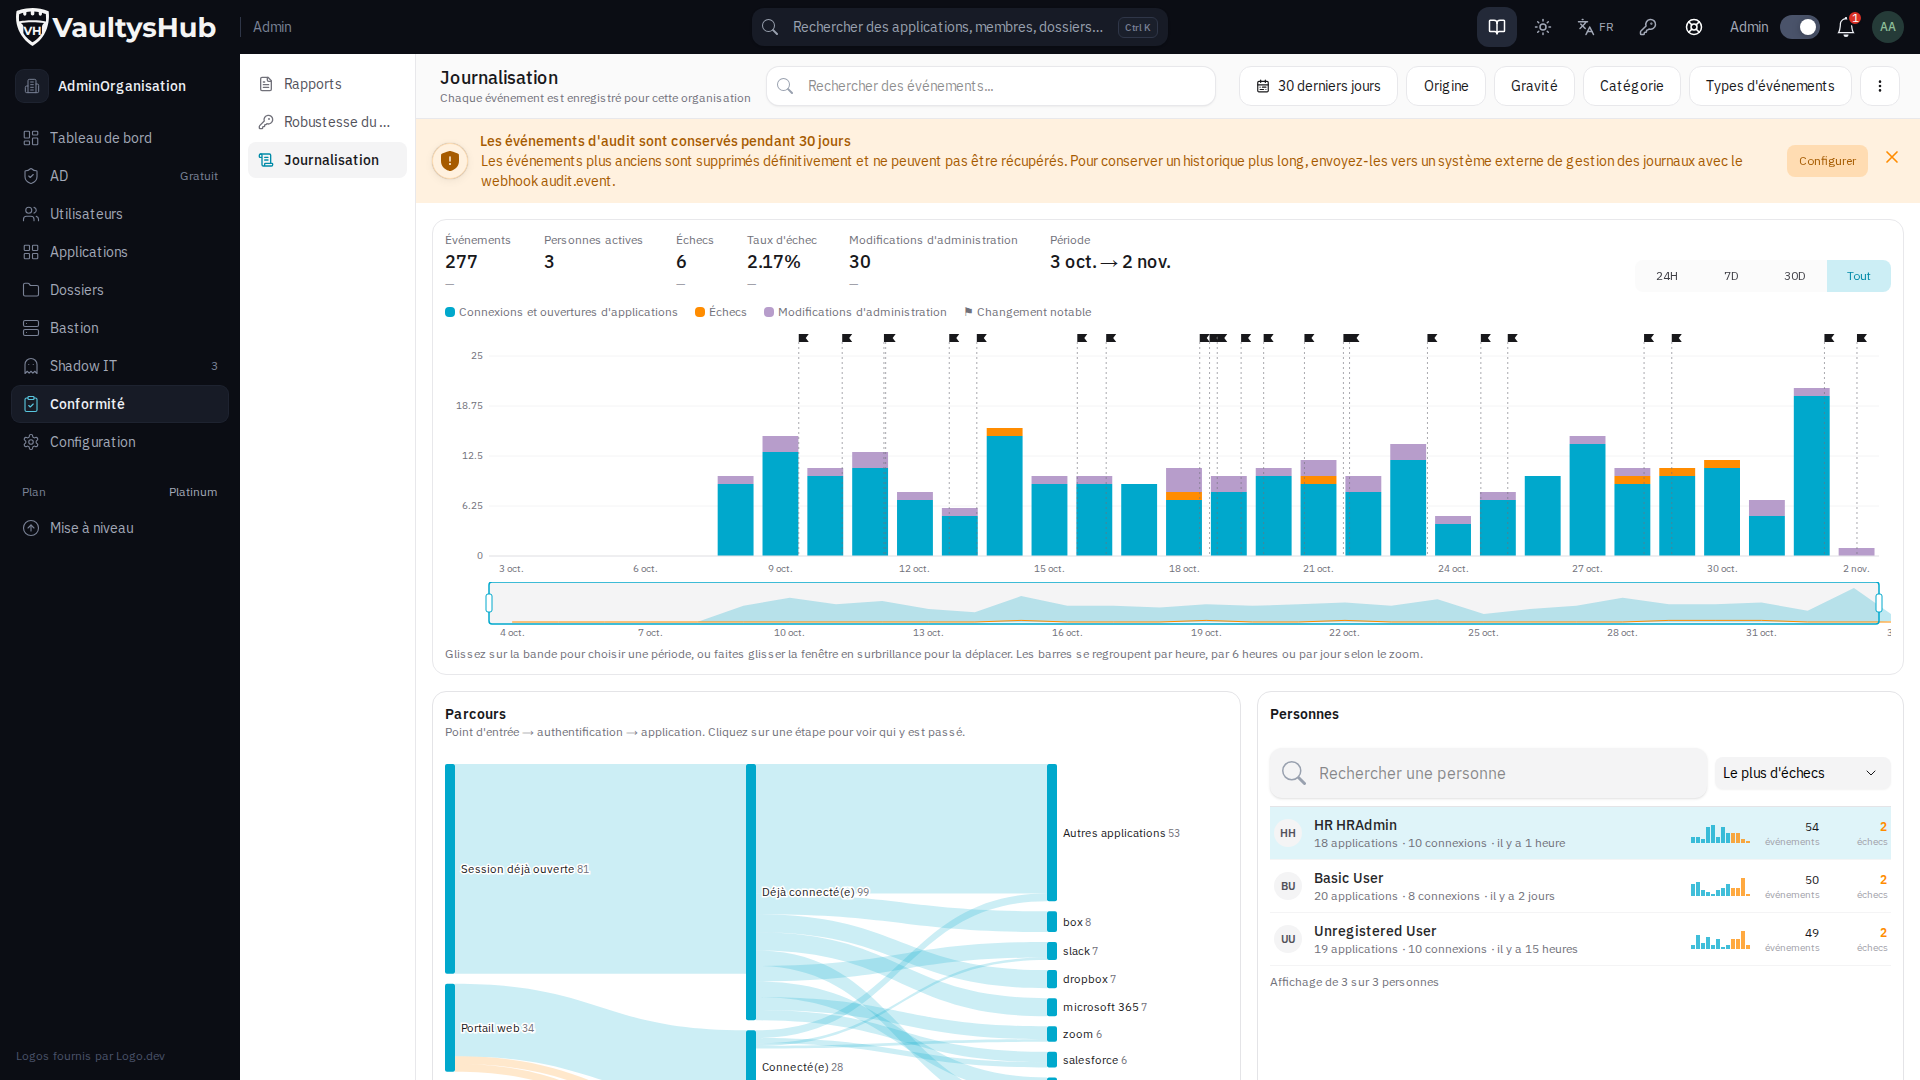
Timeline and Indicators
At the top, the indicators for the period — events, active people, failures, failure rate, and administration changes — each compared to the previous period of the same duration.
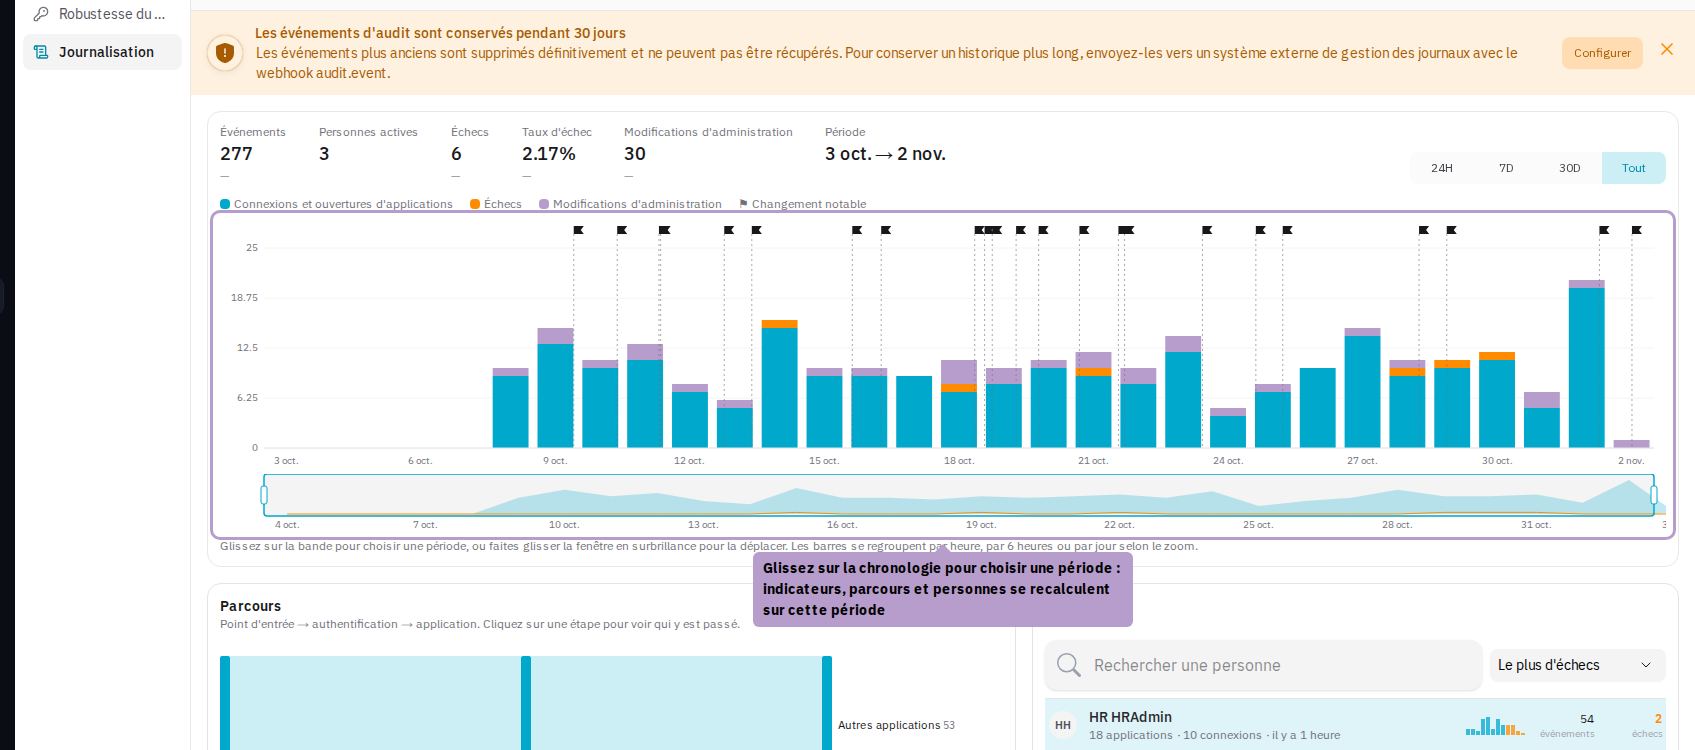
The timeline stacks, hour by hour, connections and application openings, failures, and administration changes; a flag ⚑ signals a notable change, and clicking on it opens the event. Slide on the band to choose a period, or move the highlighted window; the buttons 24H, 7D, 30D, and All select a predefined window. The bars group by hour, by 6 hours, or by day depending on the zoom.
Connection Paths and People
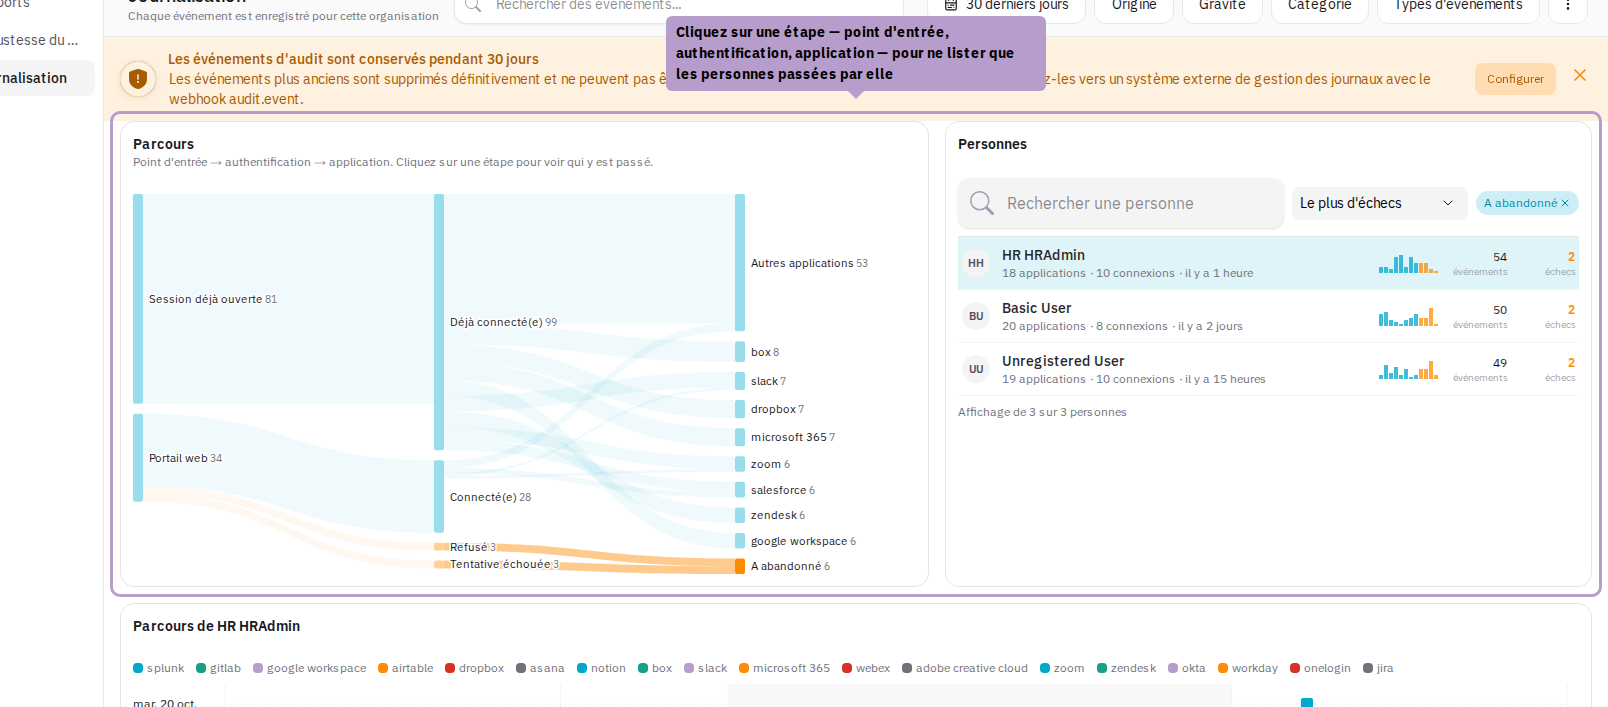
The Path diagram follows the sessions of the period, from the entry point (browser, extension…) to the authentication — successful or failed — then to the opened applications; the thickness of a band is proportional to the number of sessions. Click on a step to list, on the right, only the people who passed through it; the label above the list removes this filter.
The People list ranks active people by number of failures, by activity, or by date of last visit, with each showing their applications, connections, and a mini activity curve. A search finds anyone.
Path of a Person
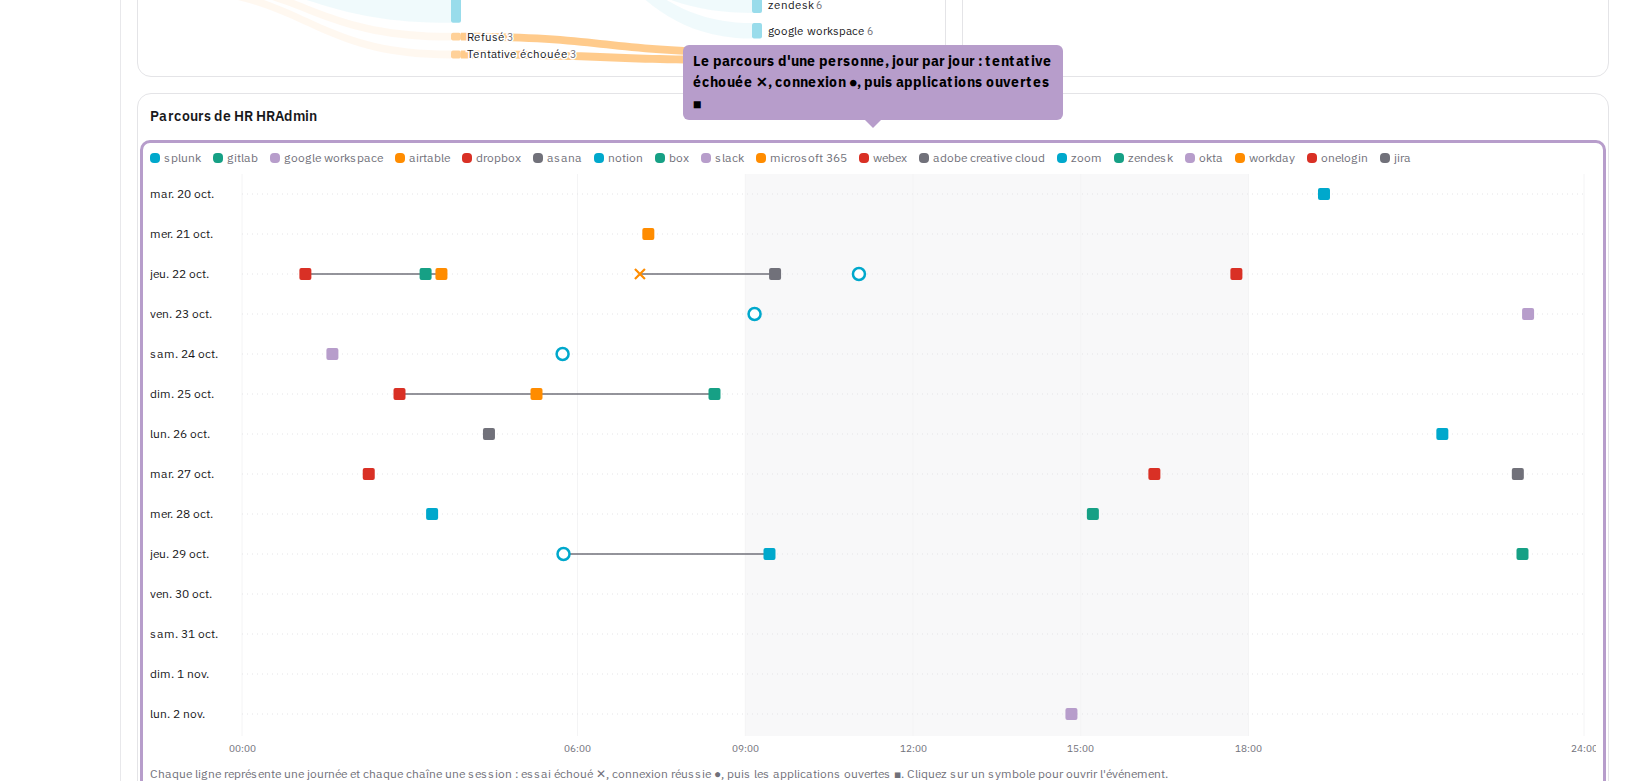
Click on a person to display their path, day by day: each line is a day, each chain a session — failed attempt ✕, connection ●, then opened applications ■. A click on a mark opens the corresponding event. Upon opening, the explorer displays the person with the most failures during the period.
The explorer covers the entire organization. The logs of a user, an application, or a folder open in the schema view, centered on that entity.
Schema View
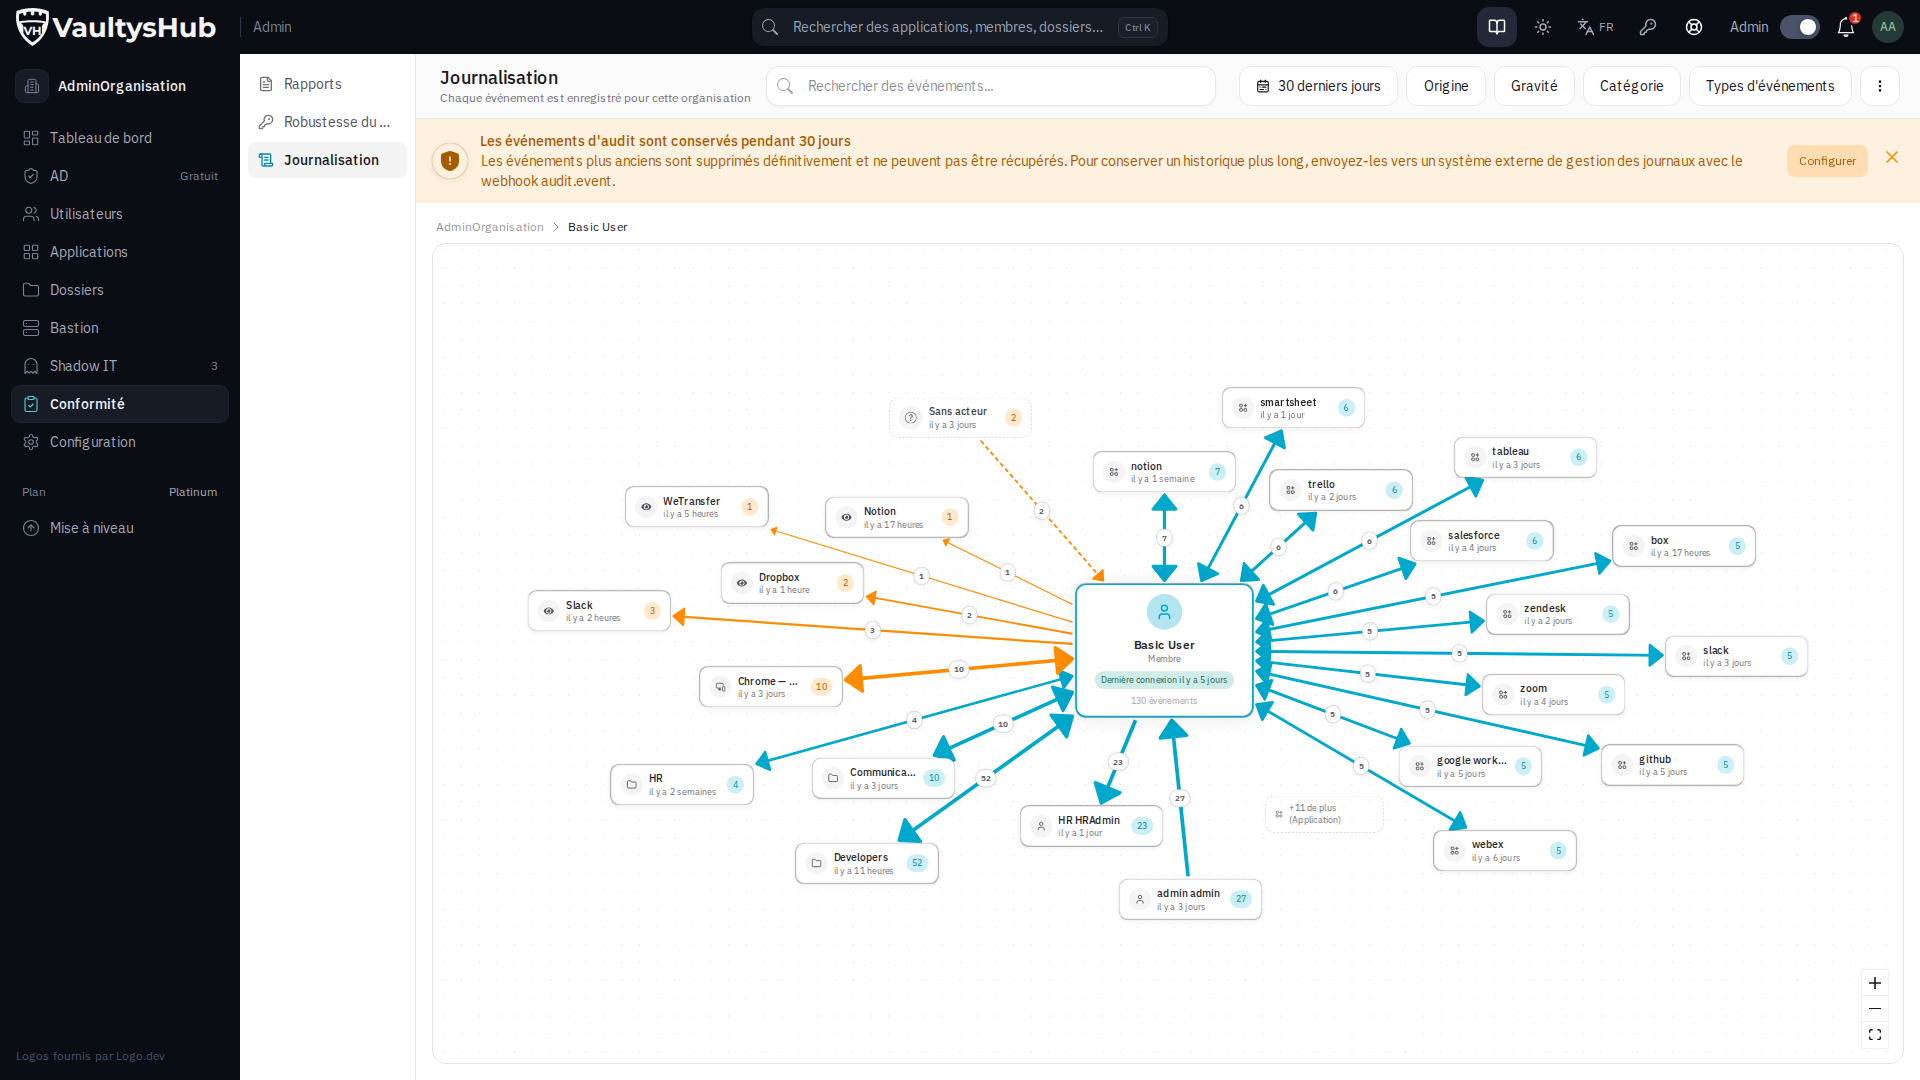
The schema places at the center what you are consulting — the organization, a user, an application… — and around it, everything it interacted with during the period: an arrow for each relationship, indicating the number of events, the most frequent type, and their direction (who acted on whom). The color of an arrow reflects the highest severity of its events, and an animated arrow signals activity of less than an hour.
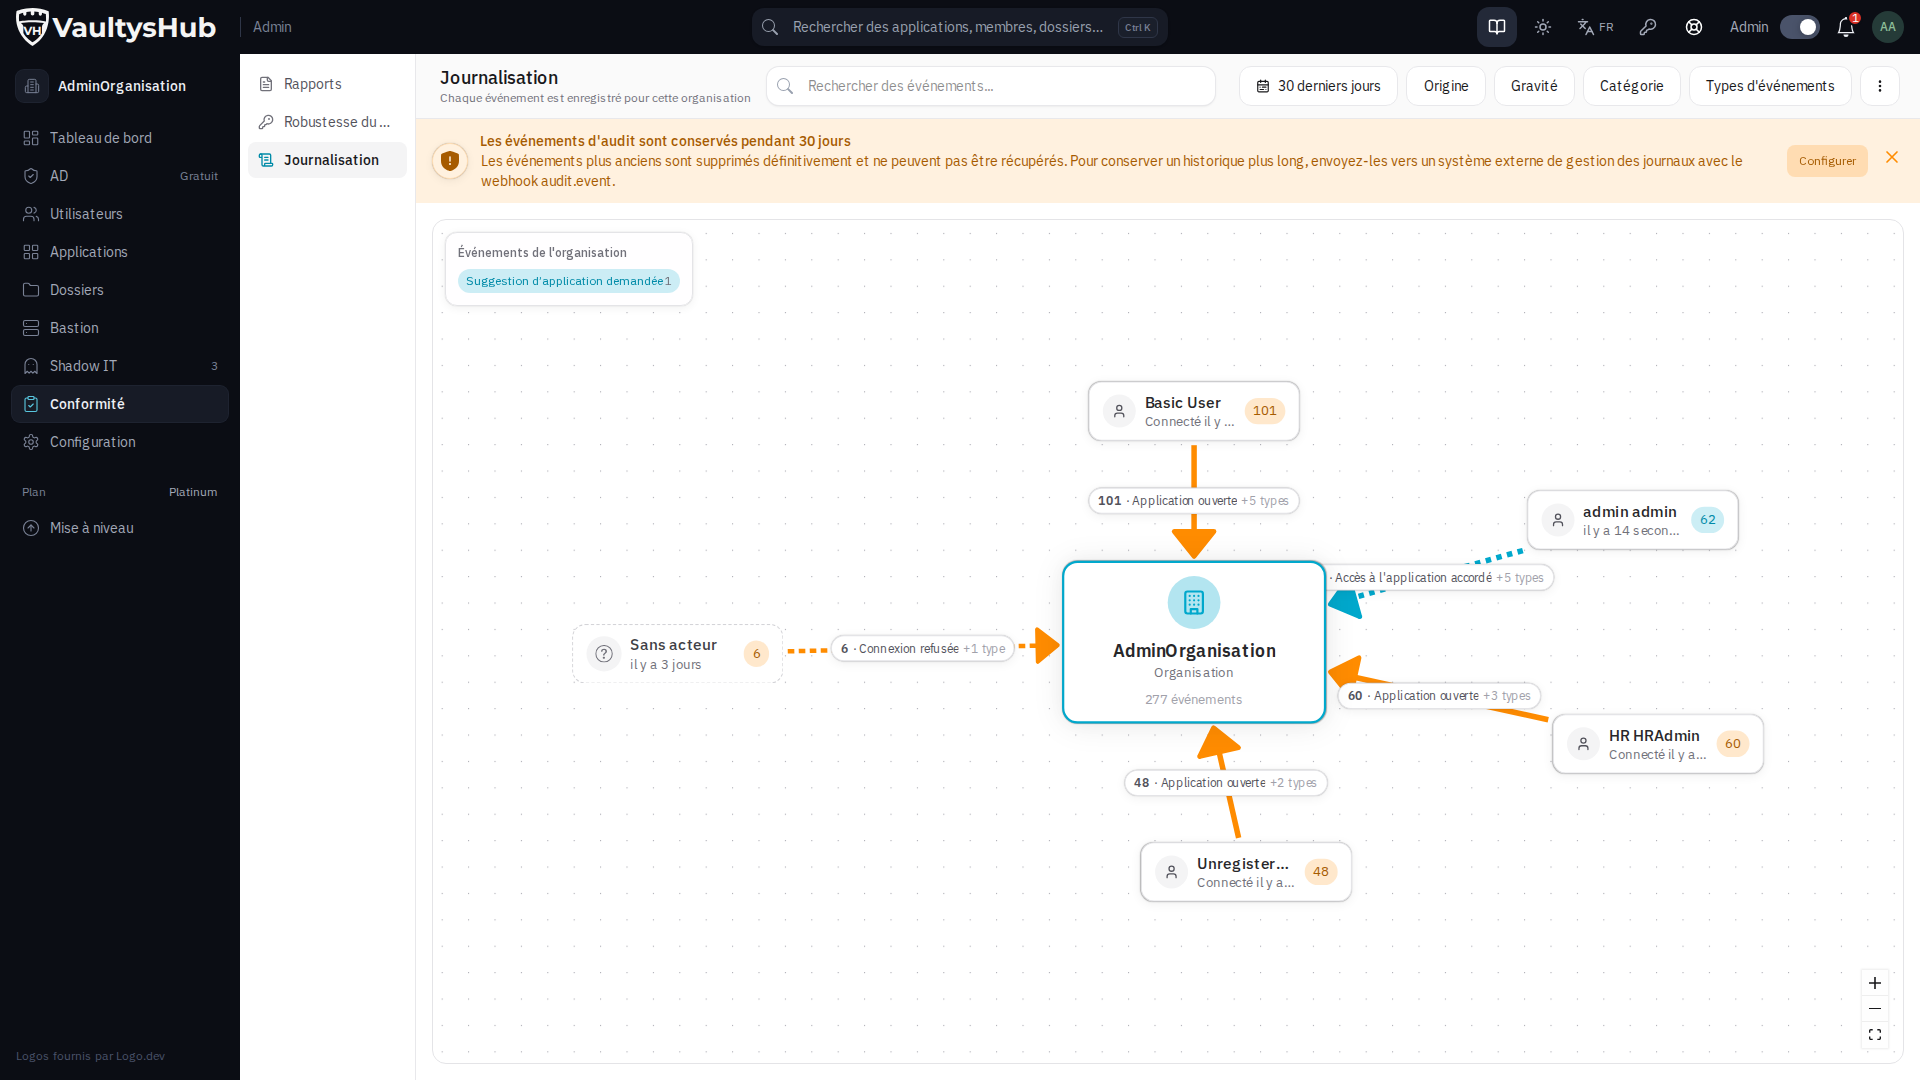
On the organization, the schema shows the active members during the period, with their last connection, and below the center, the events specific to the organization (modules, license, directory…).
Click on an entity to recenter the schema on it: from the organization, a member; from this member, an application they opened… The breadcrumb above the schema allows you to go back. On a user's profile, the schema opens by default on the period since their last connection.
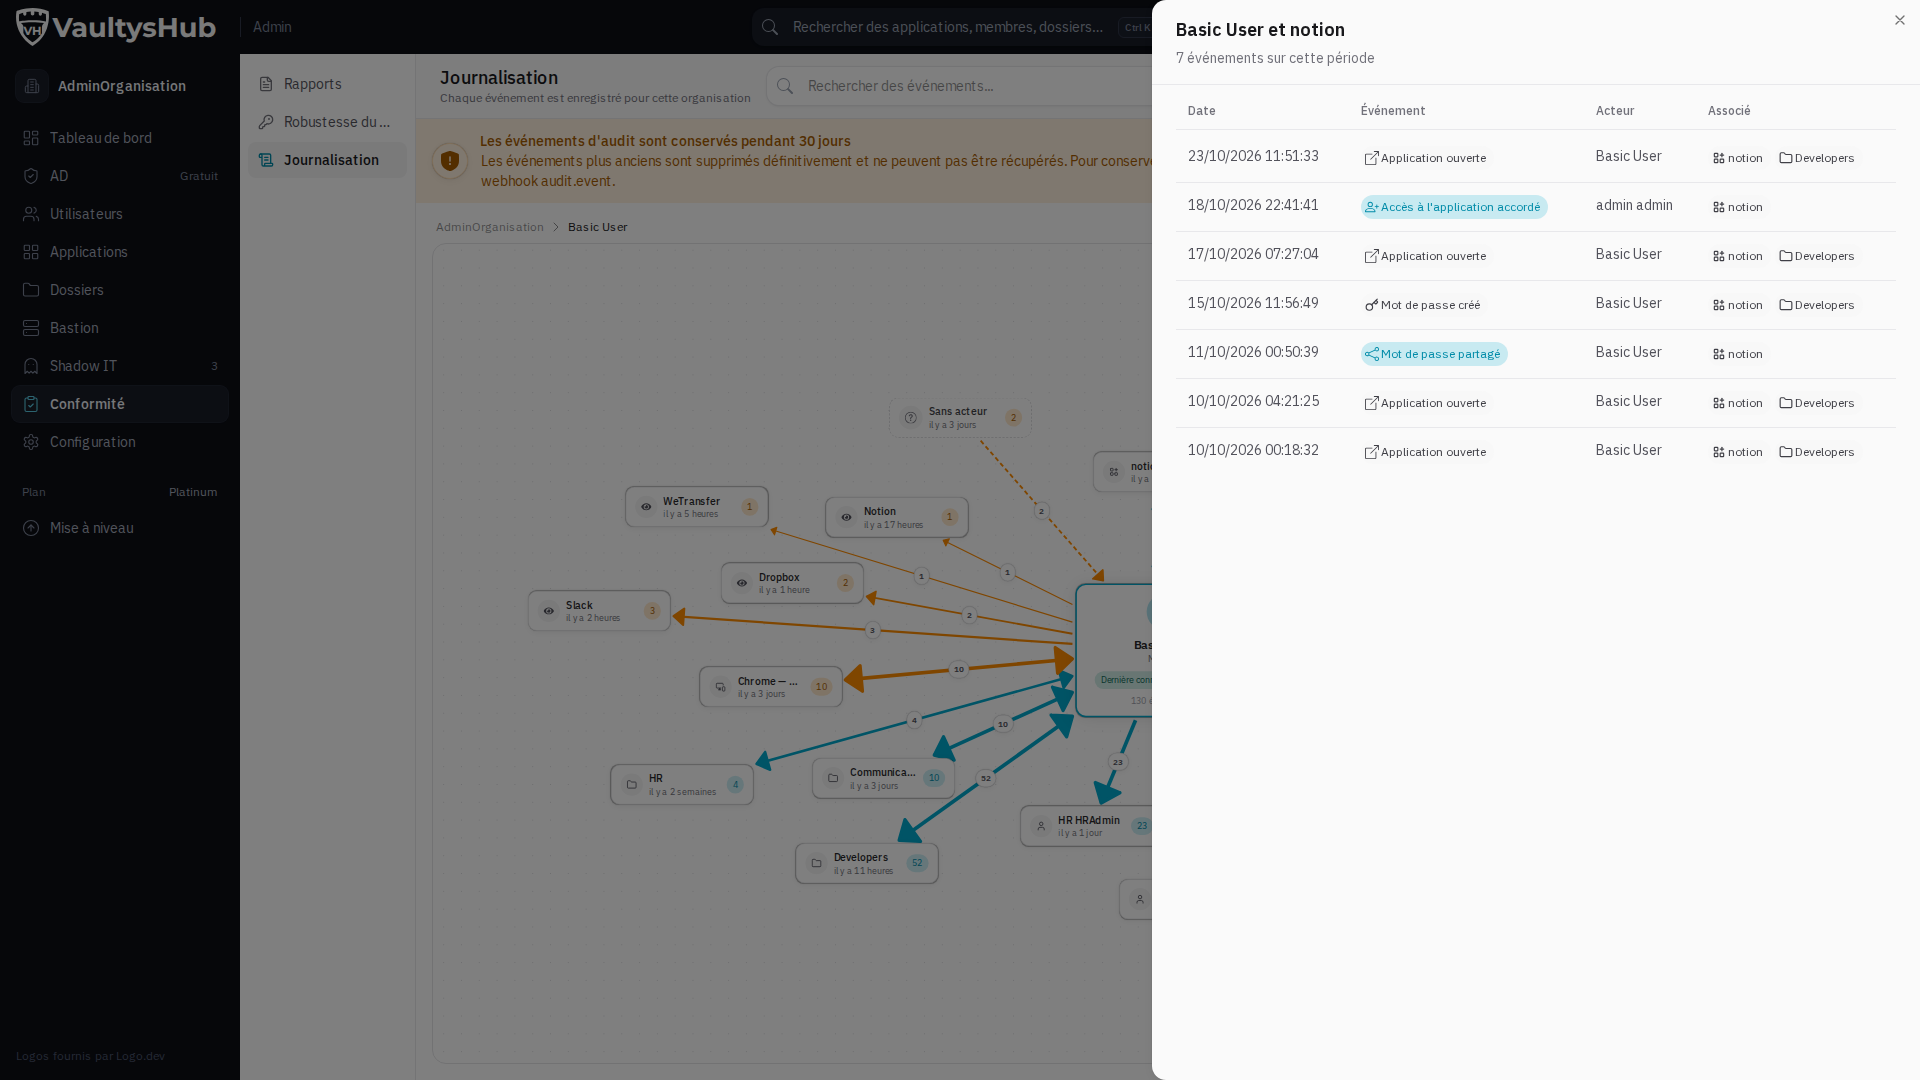
Click on the label of an arrow to list the events that compose it; each line opens the event detail.
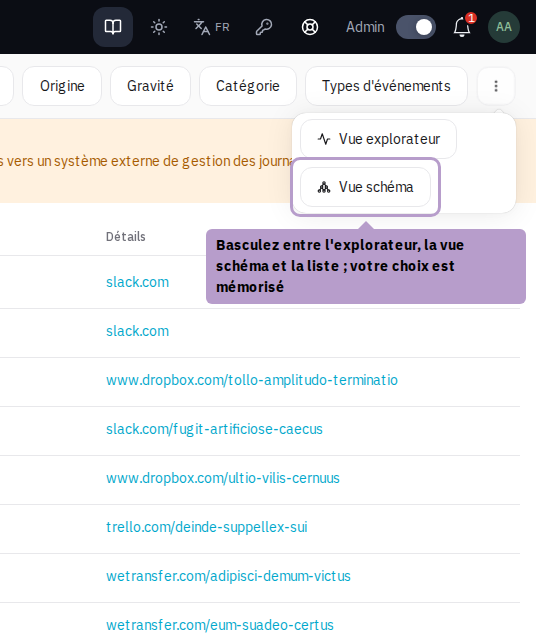
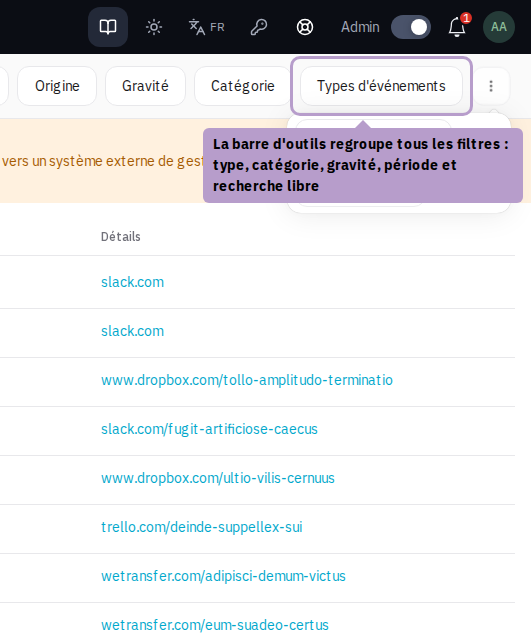
The filters in the toolbar (type, category, severity, period, search) apply to the explorer, the schema, and the list. The buttons Explorer View, Schema View, and List View switch from one view to another; your choice is remembered from page to page.
List View
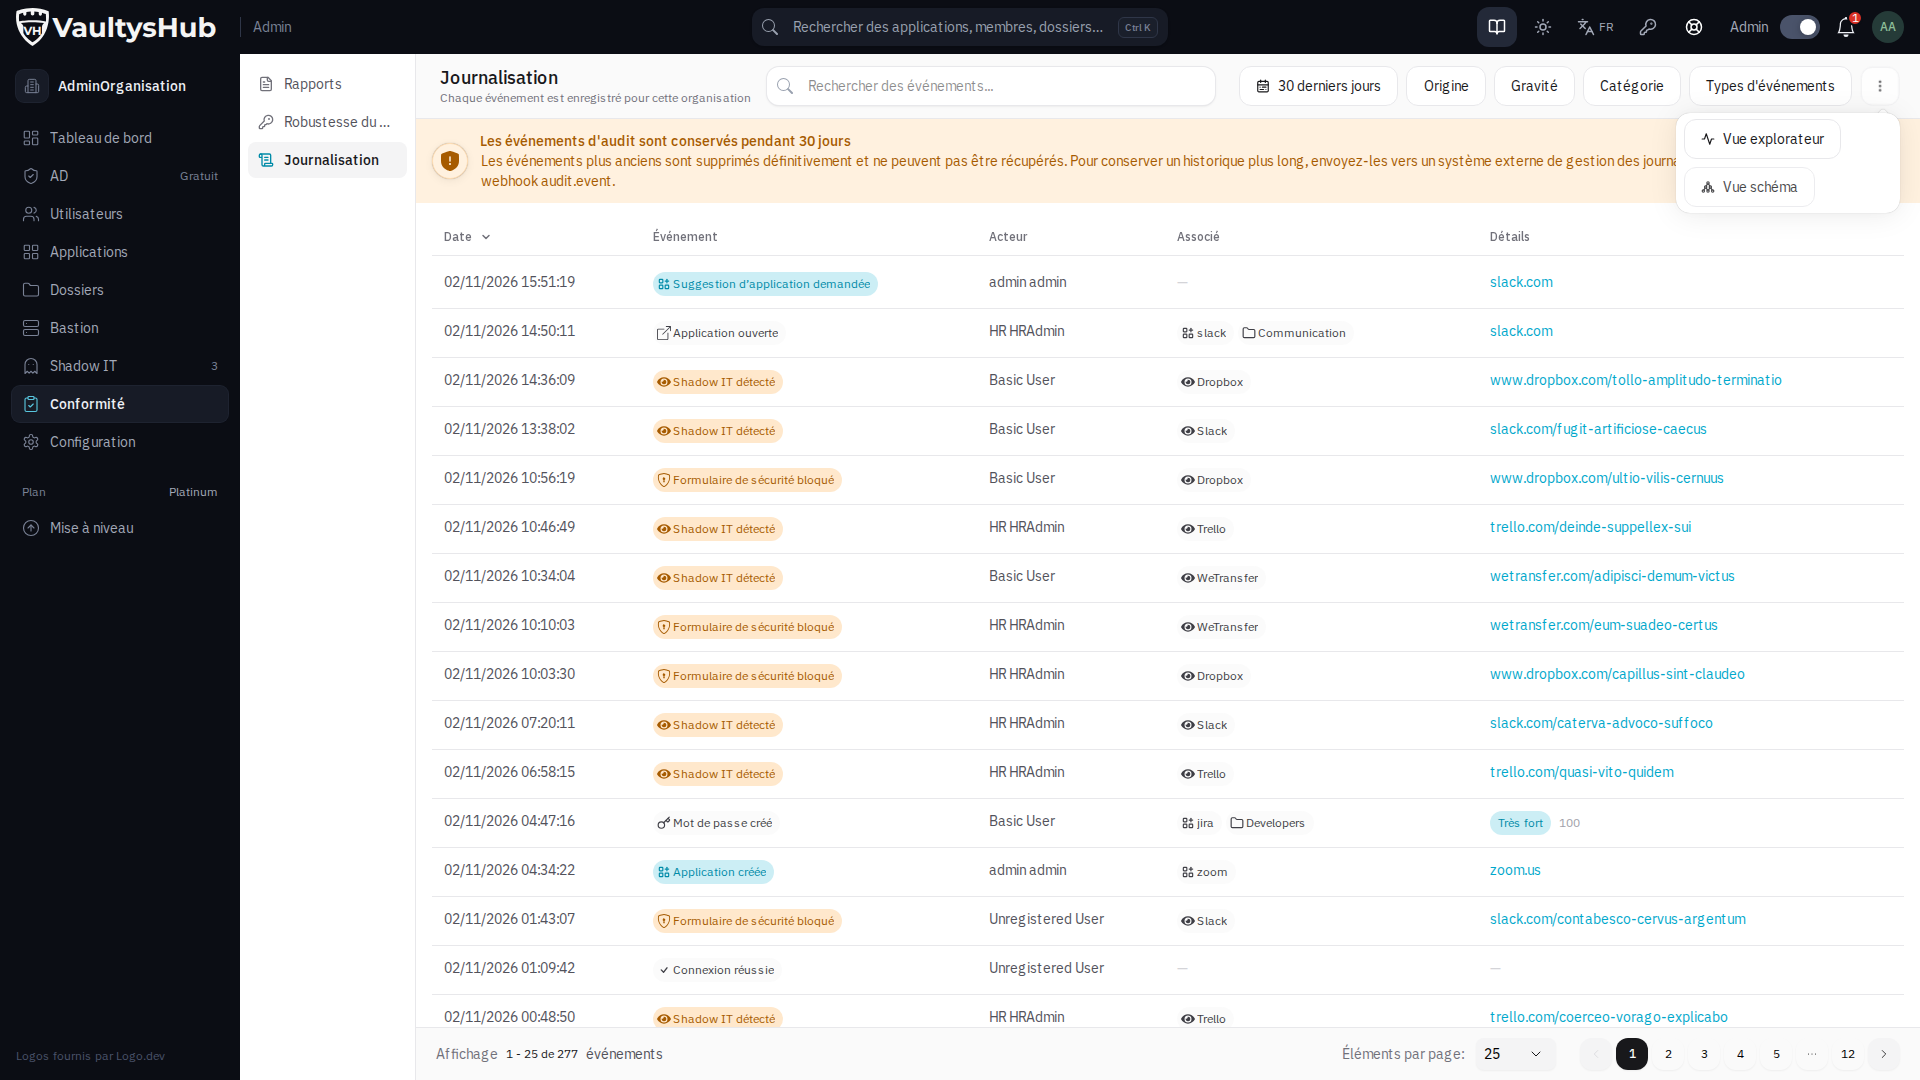
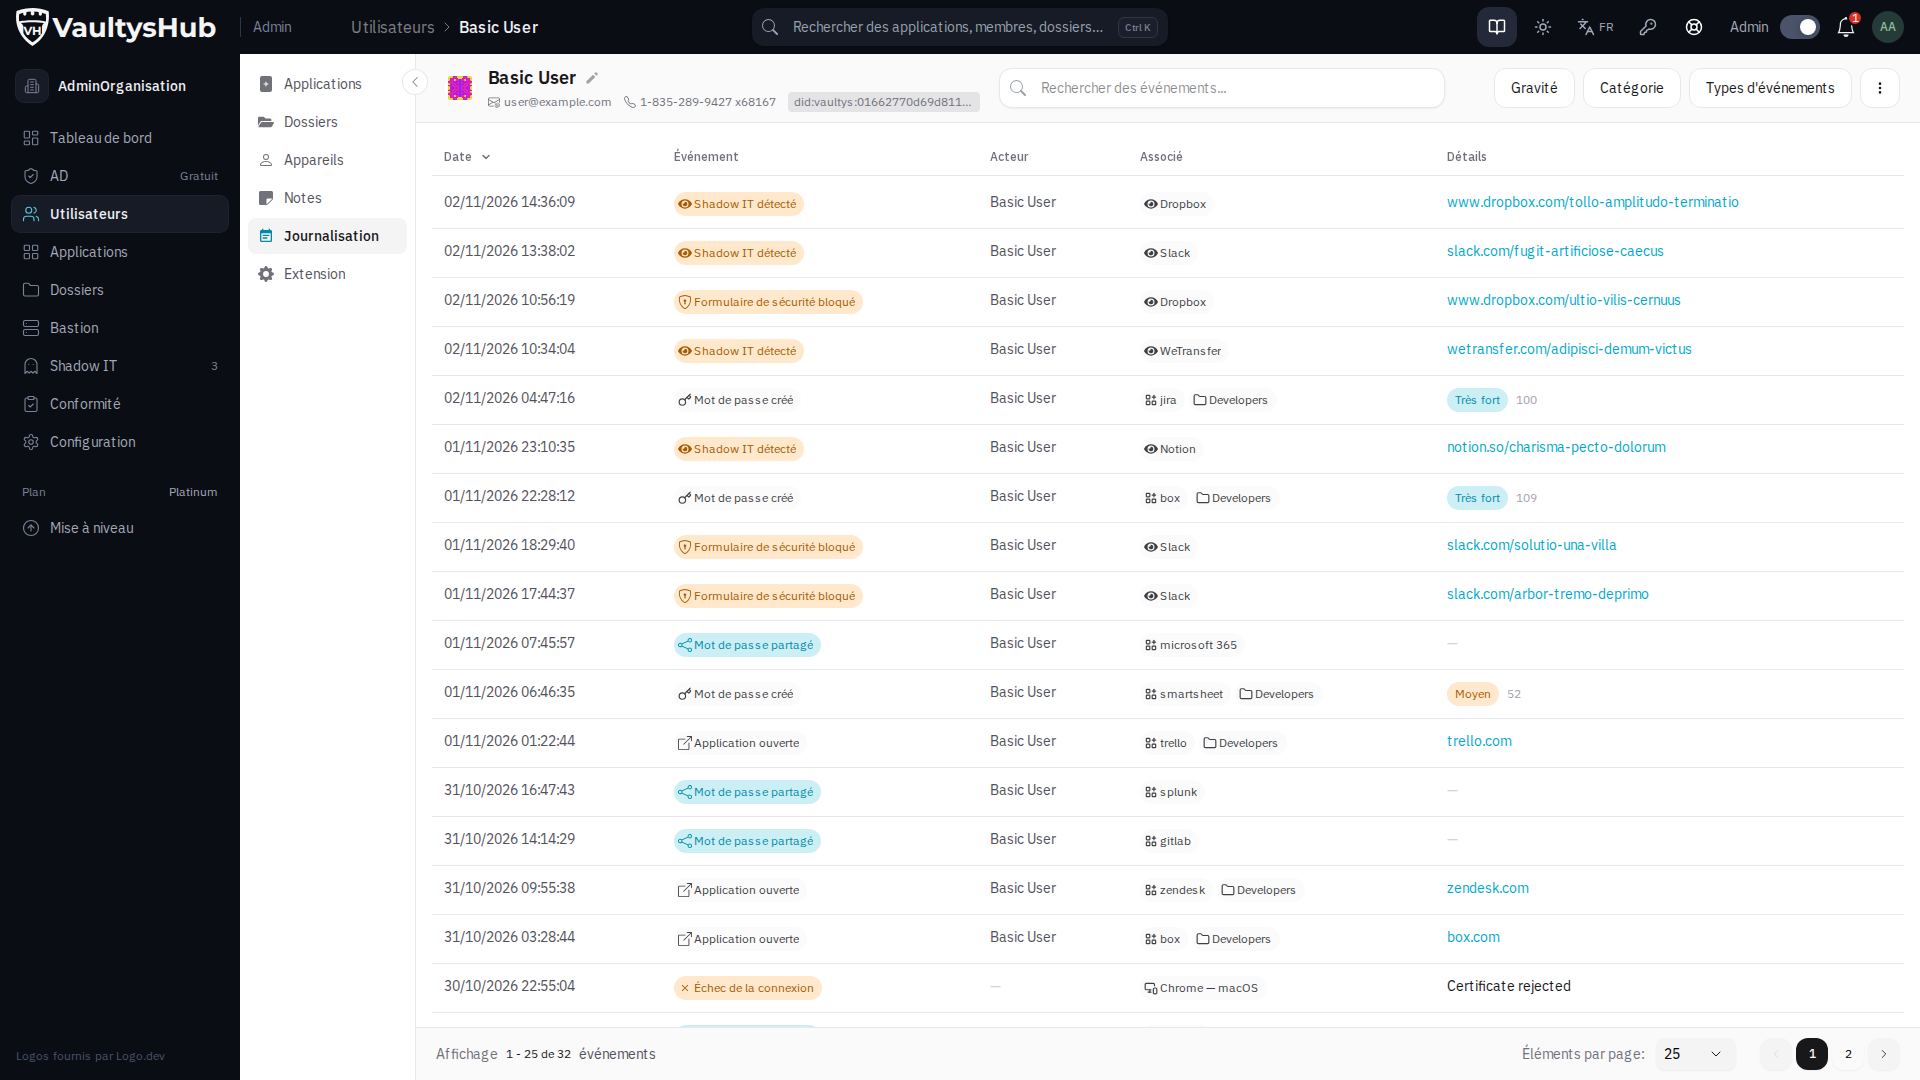
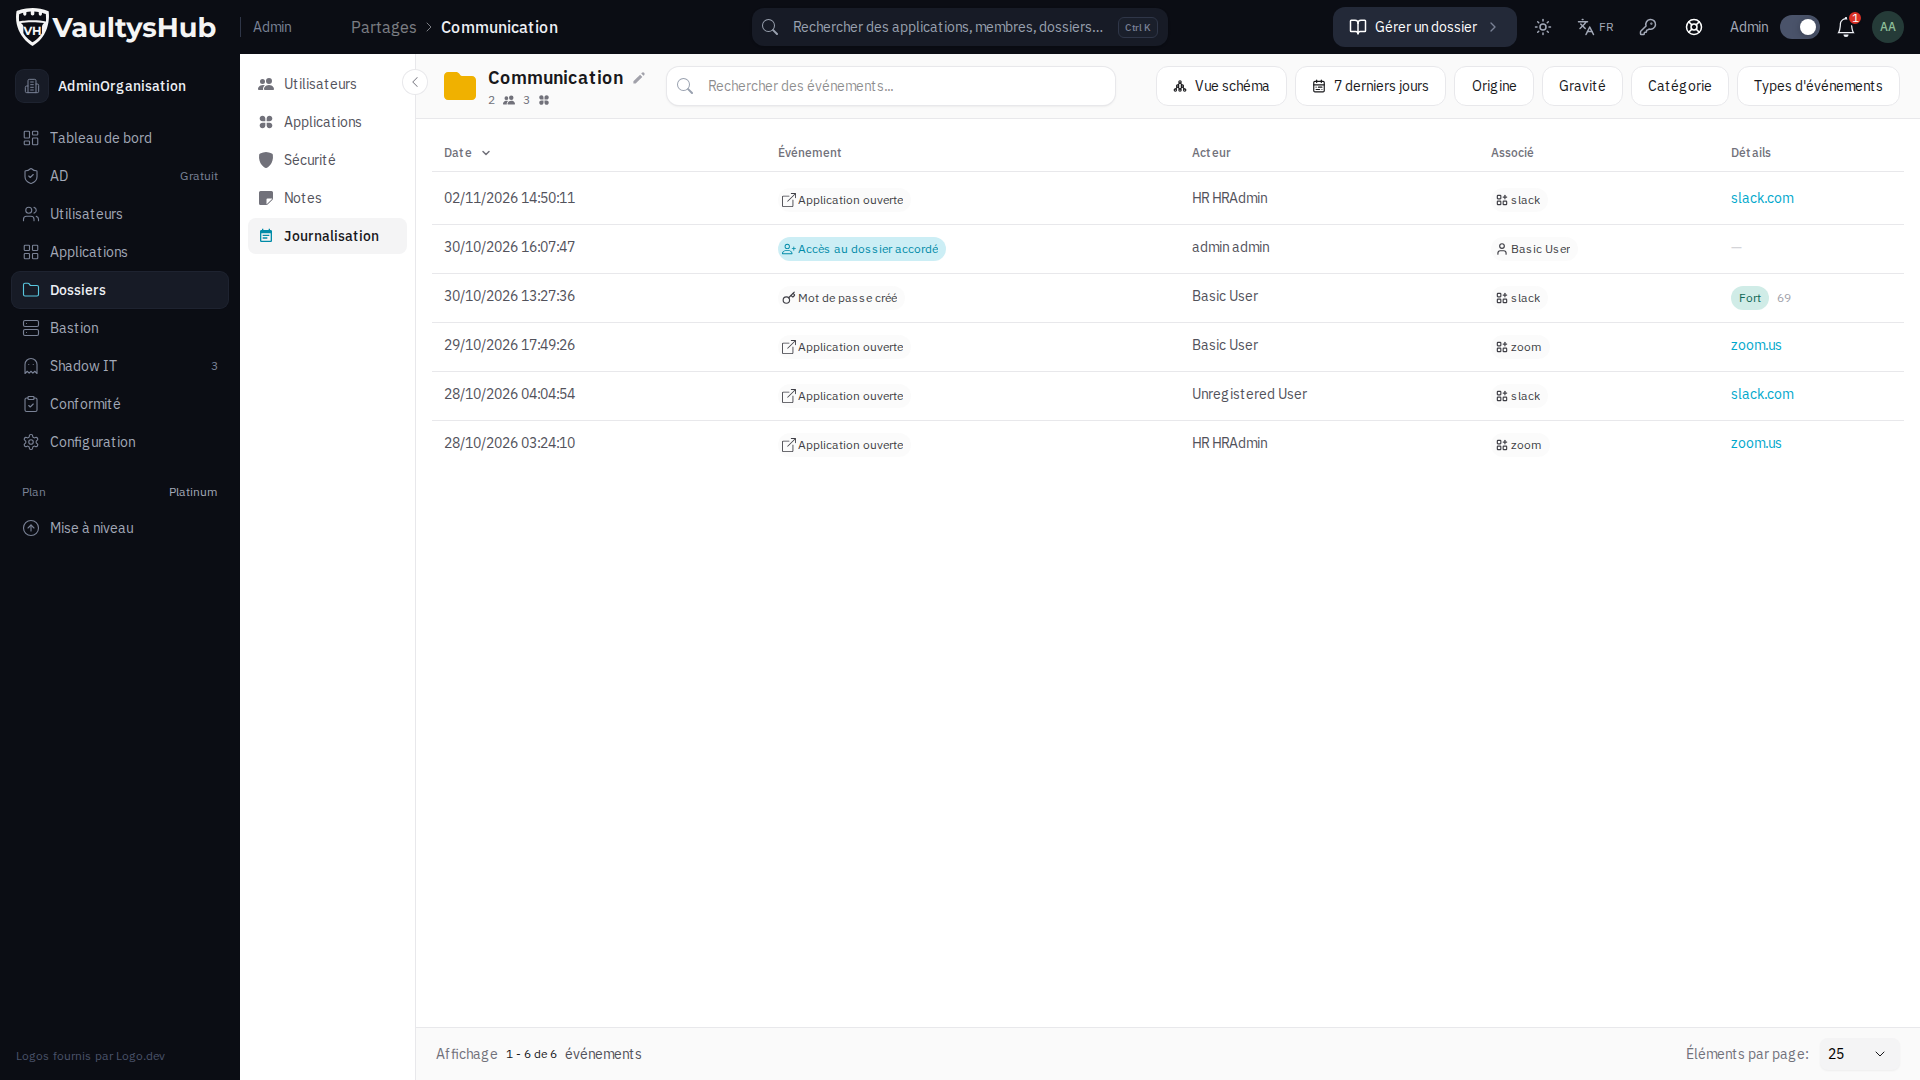
The table presents one line per event, with the columns Date, Event, Actor, Associated, and Details. The Date, Event, and Actor columns are sortable.
Events are retained for a limited time (30 days by default) and then permanently deleted. To keep a longer history, export them to an external log management system via the webhook audit.event.
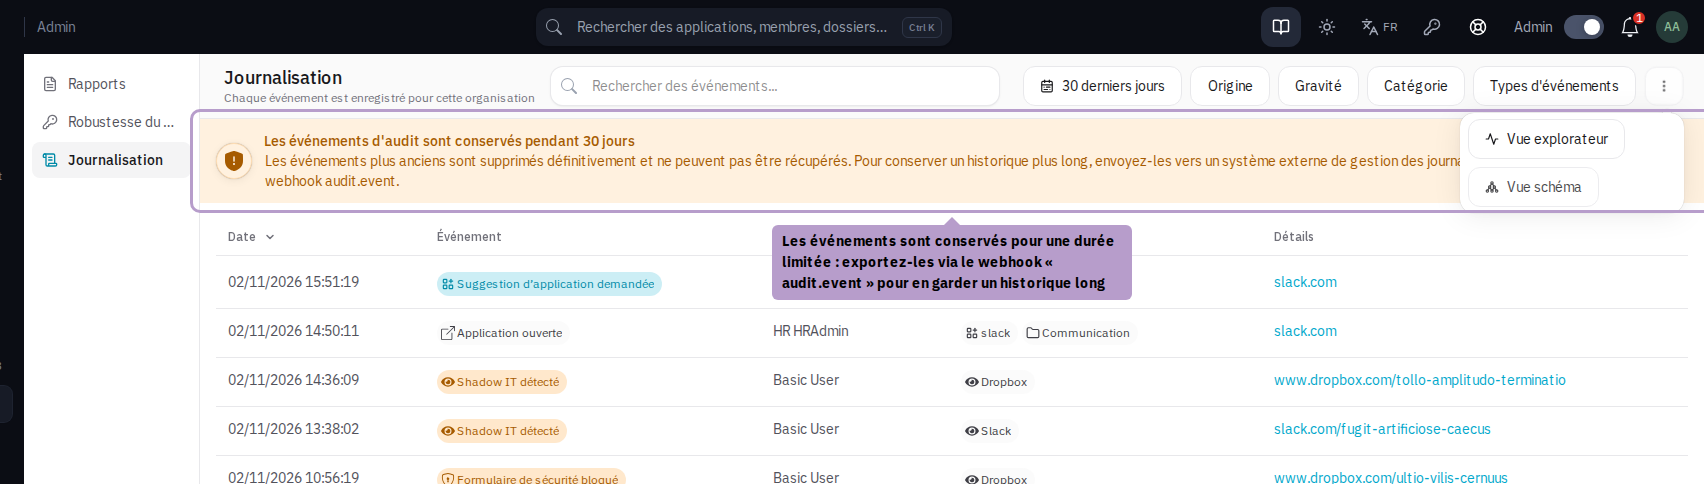
Filter the Log
The toolbar groups all filters. They combine with each other and are reflected in the page URL: a filtered view can thus be bookmarked or shared as is with an auditor.
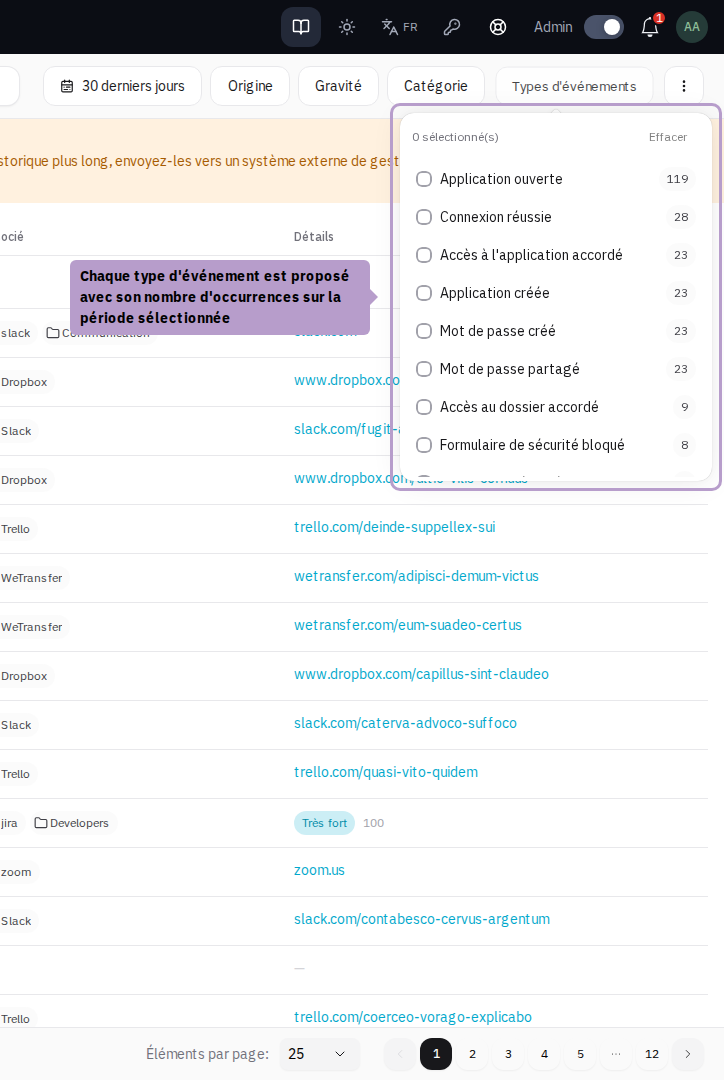
By Event Type
The Event Types filter lists all types that the platform can produce, with the number of corresponding events during the selected period. Types with no events are not offered.
By Category
A category groups event types that answer the same question. It is the filter to prioritize for a review: it continues to automatically include new event types added to the platform.
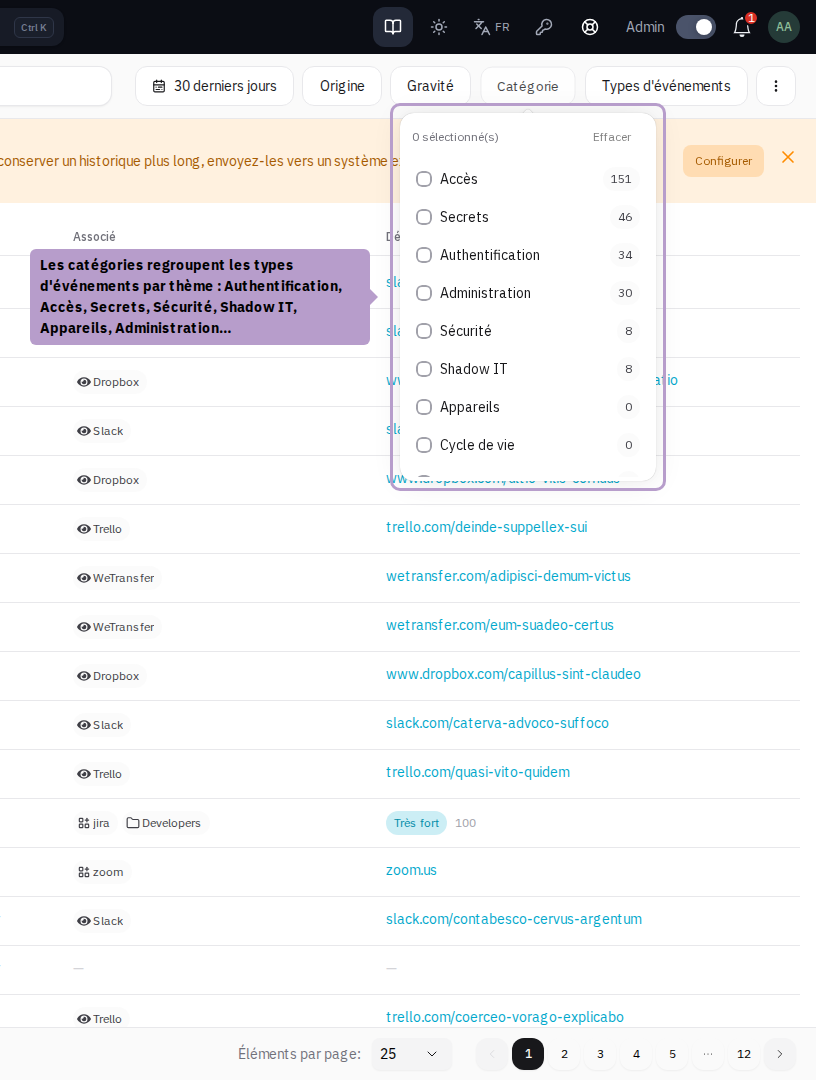
| Category | Content |
|---|---|
| Authentication | VaultysHub and extension connections: success, failure, denial |
| Access | Application opening, granting and revoking access to applications and folders |
| Secrets | Creation, sharing, and request for password change |
| Security | Forms blocked by the extension |
| Shadow IT | Detection of undeclared applications |
| Devices | Registration, authentication, denial, approval requests, temporary devices |
| Administration | Management of members, applications, folders, notes, SCIM, reports, and support |
| Lifecycle | Member registration, organization creation |
| Billing | License update and expiration |
By Severity
Severity indicates the attention an event requires. It is carried by the event type, not entered manually.
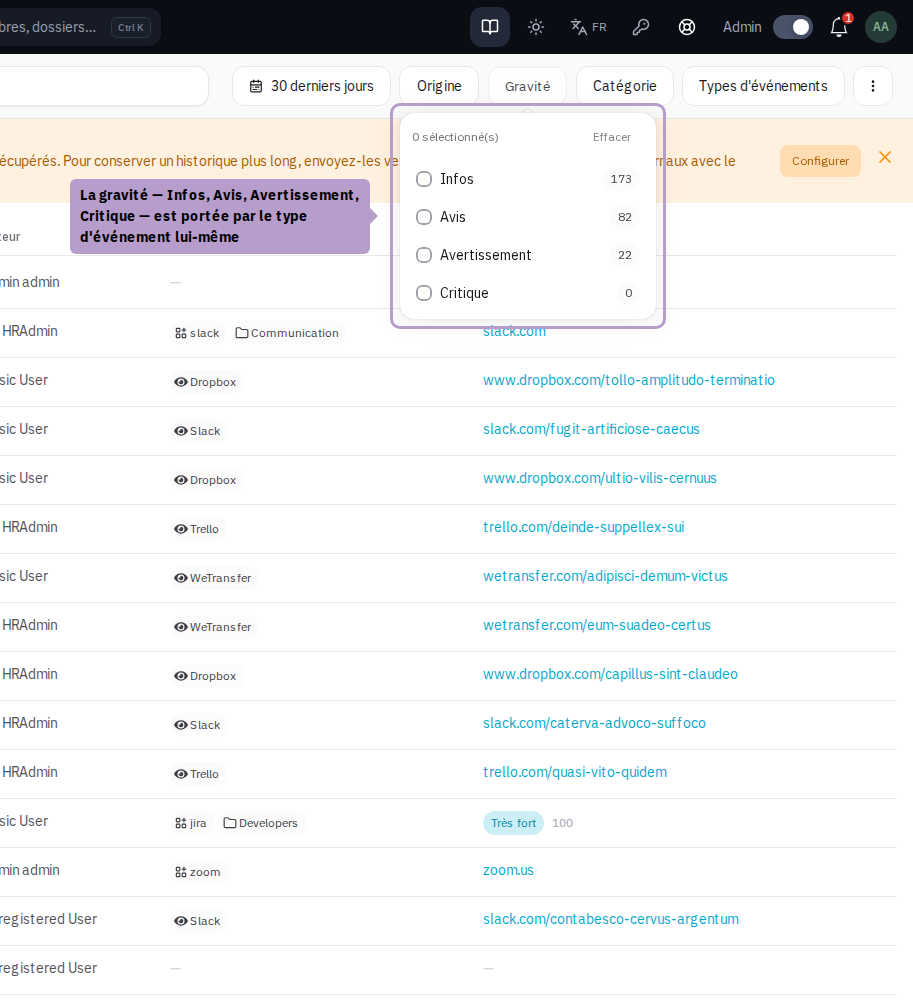
| Severity | Meaning |
|---|---|
| Info | Normal activity (successful connection, application opening) |
| Notice | Significant change to retain (member creation, password sharing) |
| Warning | Anomaly to examine (denied connection, blocked form, Shadow IT detected) |
| Critical | Incident requiring immediate action |
By Period
The period filter offers the windows Last 24 hours, Last 7 days, Last 30 days, and All retained, as well as a custom range.
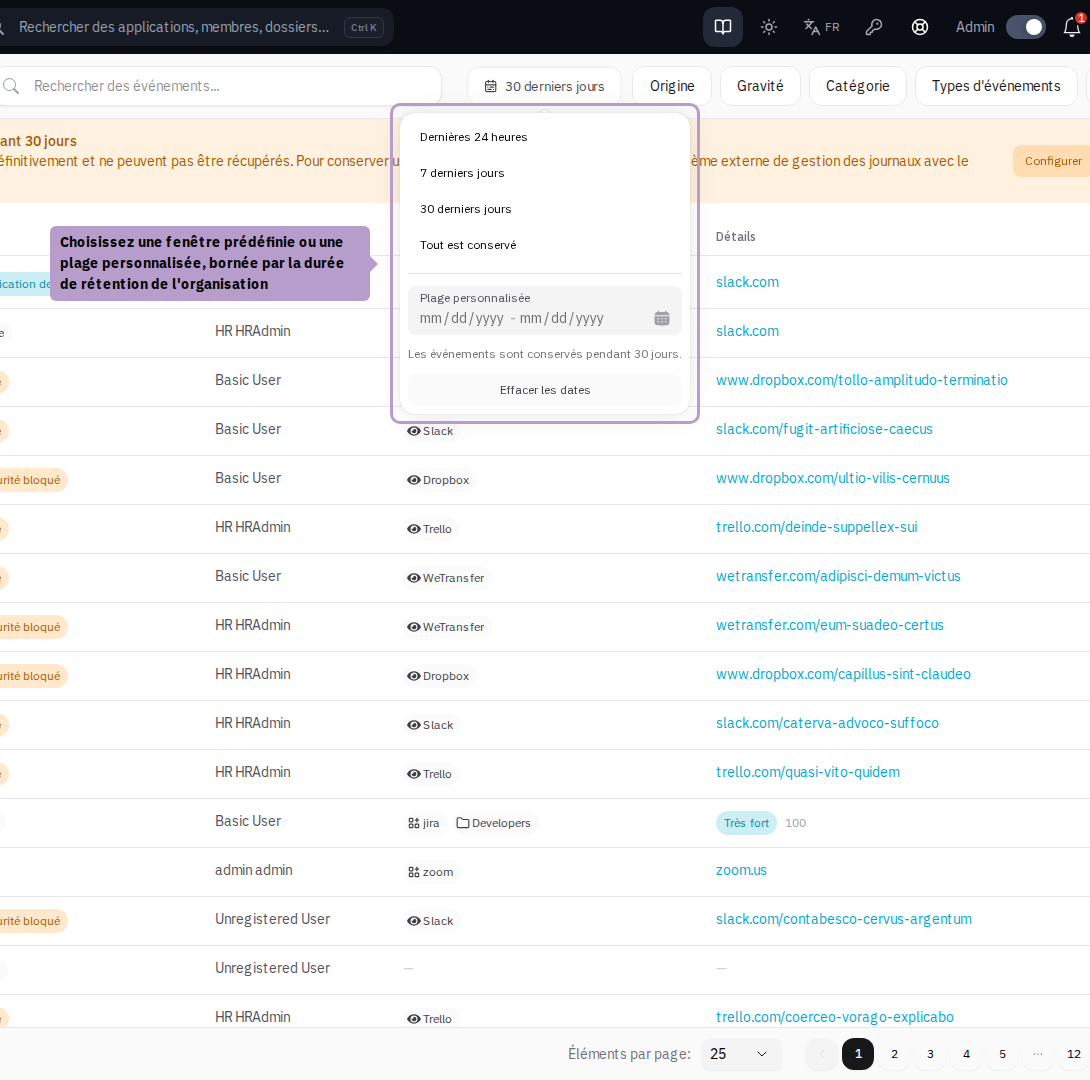
The custom range is bounded by the organization's retention period: it is not possible to select a window that is known to contain no events.
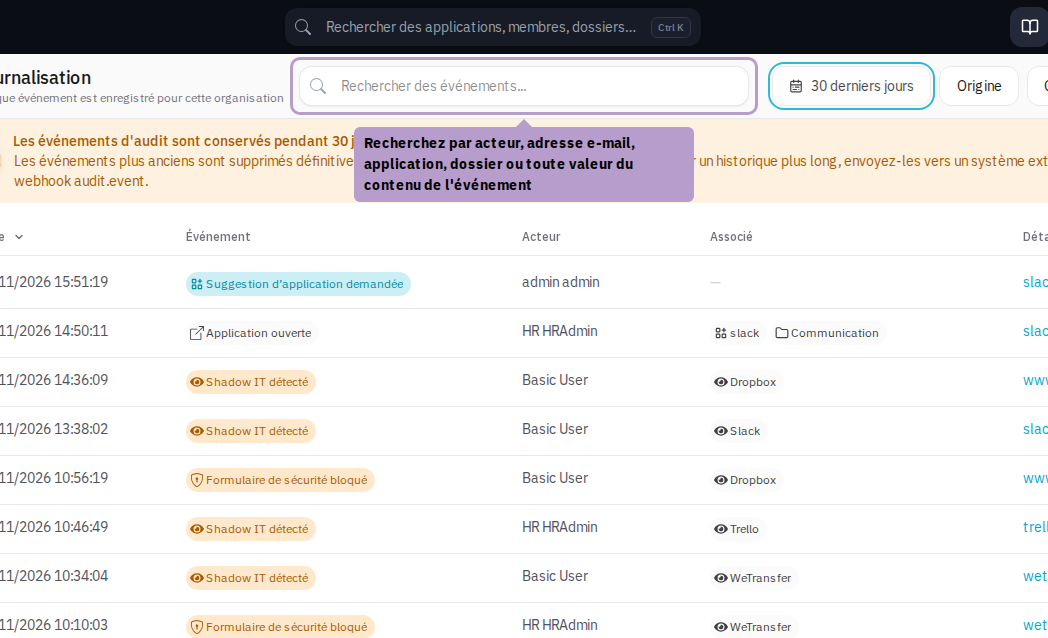
Free Search
The search bar filters on the text of events: actor name, email address, application or folder label, values of the event content.
Reset
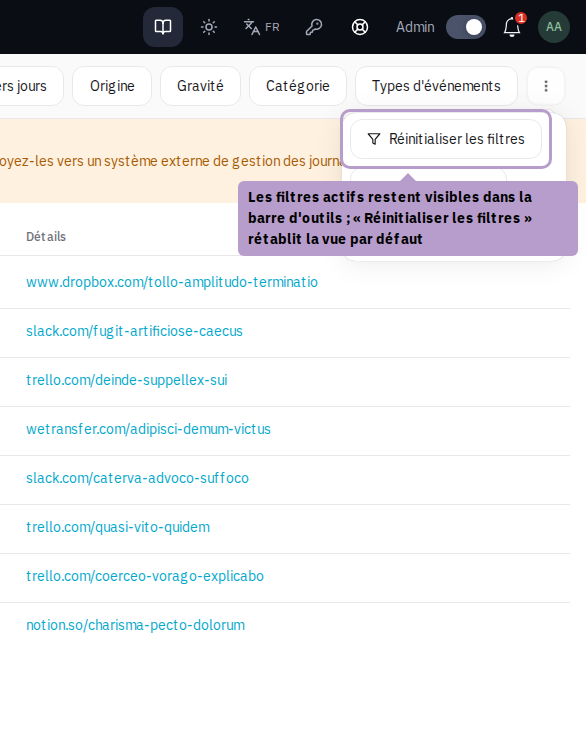
Each active contextual filter appears as a removable label. The Reset Filters button restores the default view.
Event Detail
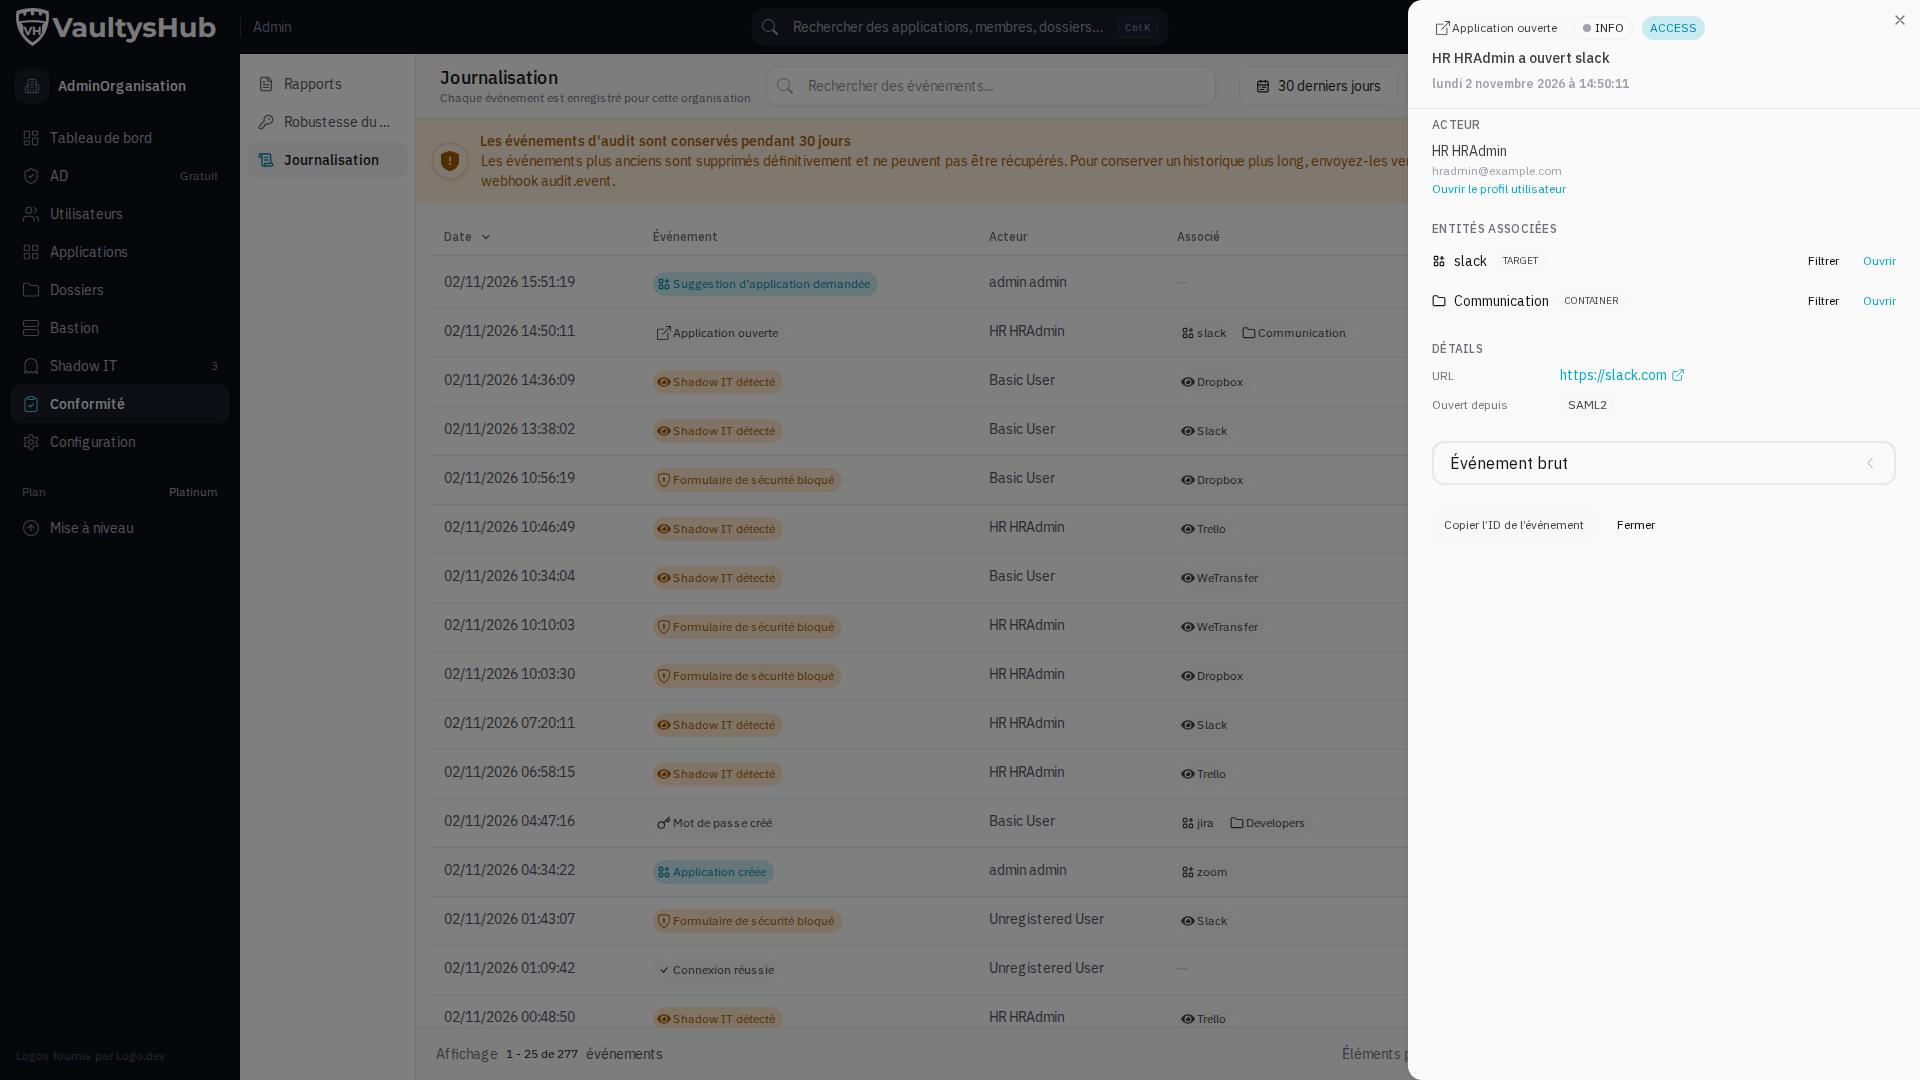
Clicking on a line opens a side panel presenting the entirety of the event: its descriptive phrase, severity, category, exact date, actor, and typed content.
Associated Entities
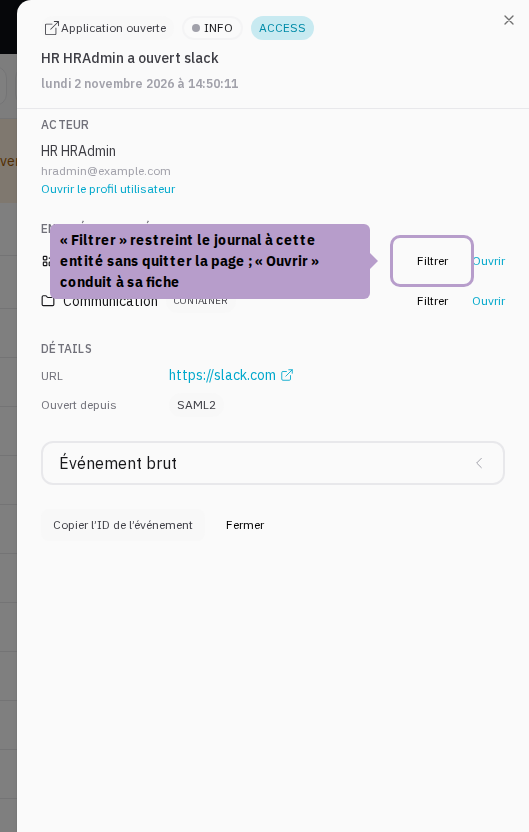
The Associated Entities section lists all entities concerned by the event, each with its role. Open leads to the entity's profile, Filter restricts the log to this entity without leaving the page.
Raw Event and Identifier
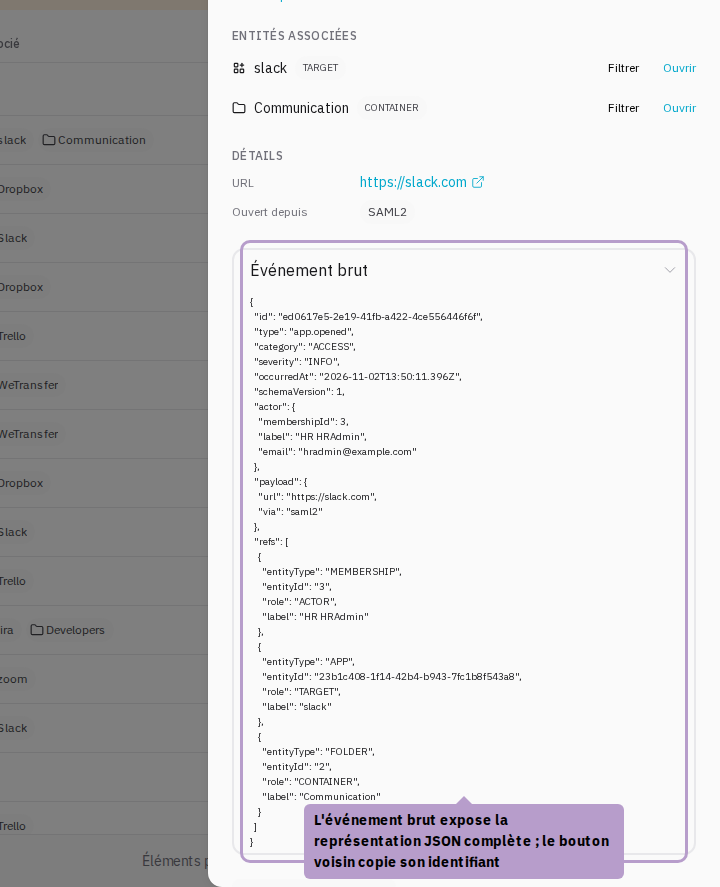
The Raw Event block exposes the complete JSON representation, and Copy Event ID retrieves its identifier — useful for referencing a specific event in an audit report or ticket.
Contextual Filter from the Table
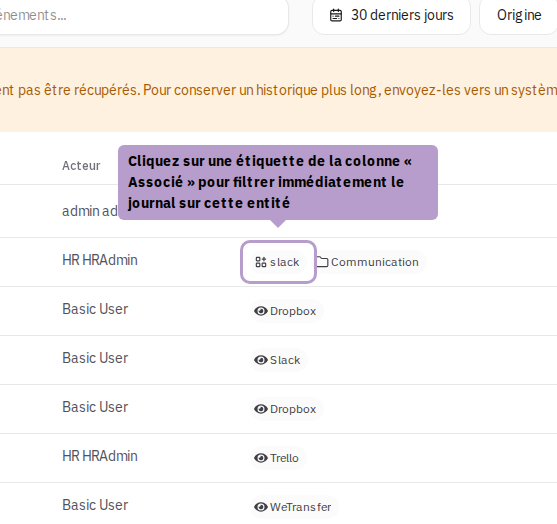
The labels in the Associated column are clickable: a click directly adds a filter on the corresponding entity. This is the shortest path to move from an event to the entire history of the application, folder, or user it mentions.
Pagination
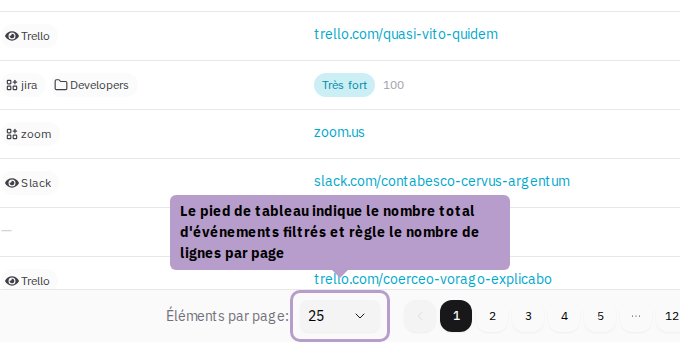
The table footer indicates the total number of events matching the filters and allows adjusting the number of displayed rows (10, 25, 50, or 100).
From a User's Profile
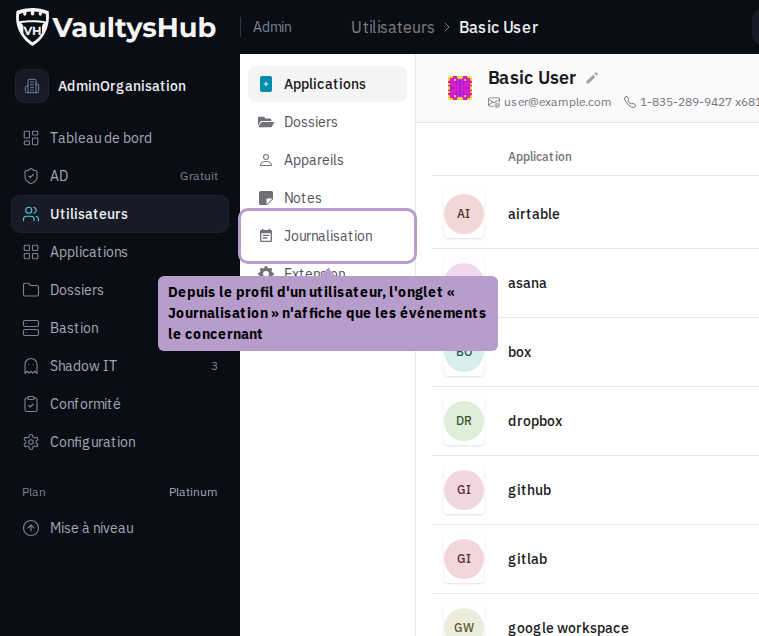
The log is also accessible from a user's profile, to display only the events concerning them.
From an Application's Profile
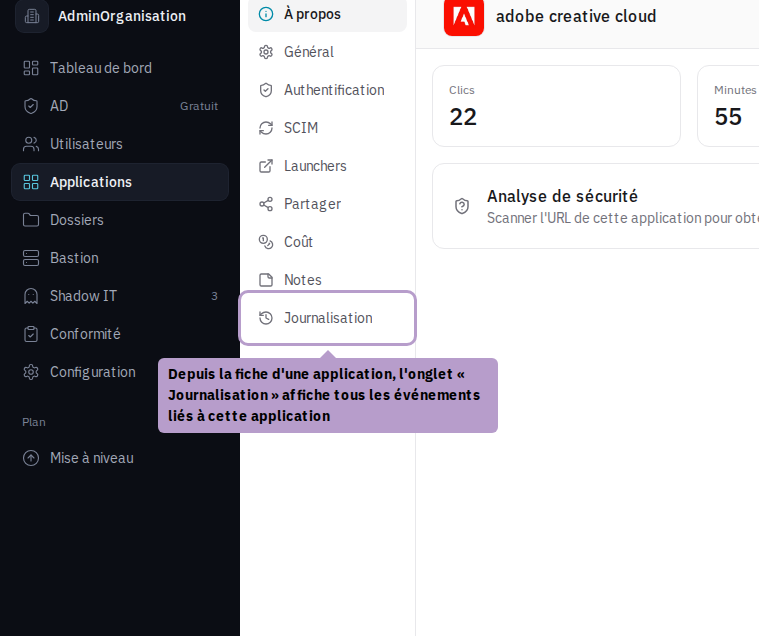
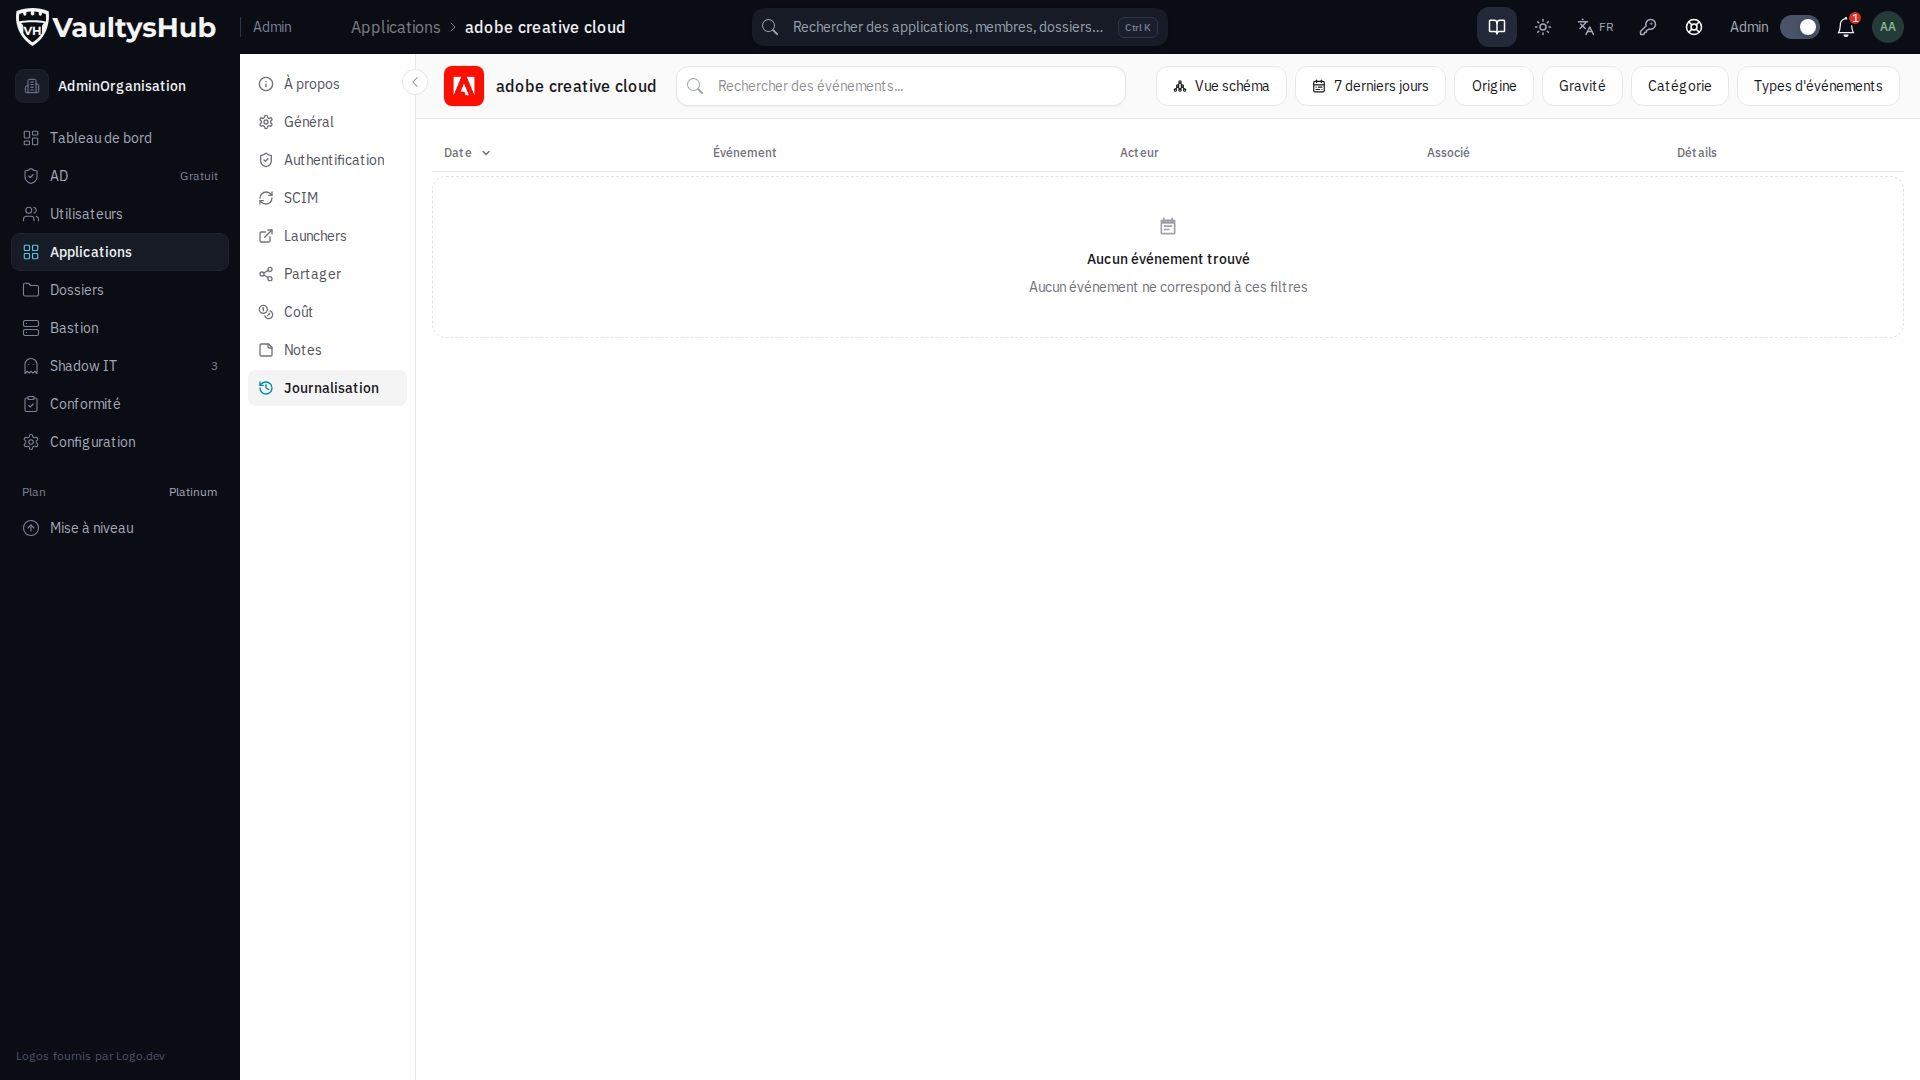
Each application has its own Logging tab, which lists all events related to that application.
From a Folder's Page
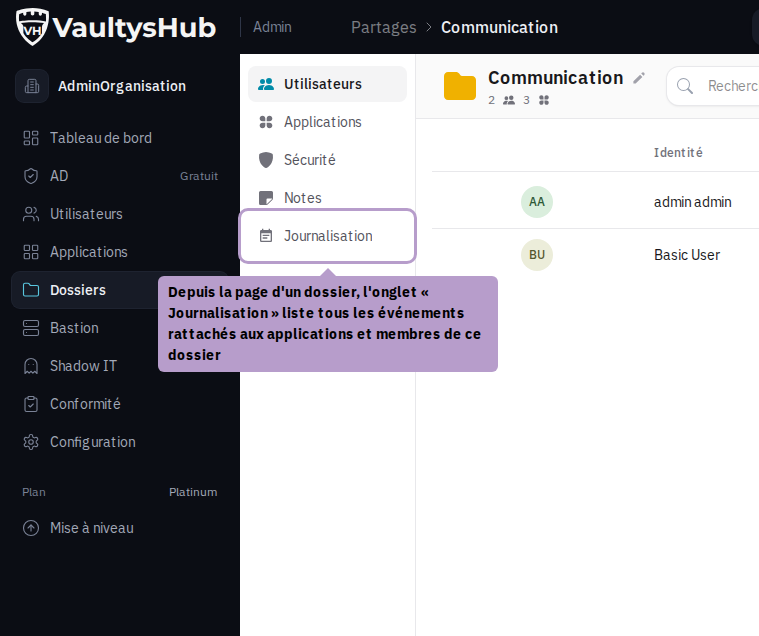
The Logging tab of a folder displays all events from the applications and members associated with it.
In these three views, the filter on the entity is locked: filters by type, category, severity, and period remain available, but the scope cannot be inadvertently widened.